Custom row order
Using a work-around to order table rows with a popular and versatile R package
This post shares a coding solution I used to meet the reporting preferences for my collaborators at the State of TN Department of Intellectual and Developmental Disabilities. The therapeutic services team monitors and tracks adverse events such as when someone in the community falls and requires medical attention. They calculate descriptive statistics for each agency to identify where mitigation training will be most effective. However, they are reporting on so many factors that computing descriptive statistics for each agency was prohibitive for actionable information.
Use case for gt tables
This is where I identified an opportunity to alleviate pressure in the report workflow. I used R and R Quarto to compute descriptive statistics and develop executable report templates. I chose to use the gt package to generate report-ready tables. There are multiple customization opportunities for gt tables and the language is integrated with the tidyverse. For this task, I liked the grouping (by agency) functionality and that the tables will be customizeable for future reporting needs.
Let’s load some example data:
Code
load(file = "data/ex_factors.rdata")

head(ex_factors, 5)
# A tibble: 5 × 10
anon_agency factor region_count region_percent incidence percent
<chr> <chr> <dbl> <dbl> <dbl> <dbl>
1 agency10 both_ext_int 0 0 0 0
2 agency10 fall_hist 0 0 0 0
3 agency10 familiar 0 0 0 0
4 agency10 intrinsic 0 0 0 0
5 agency10 hear_deficit 0 0 0 0
# ℹ 4 more variables: region_count_si <dbl>, region_si <dbl>,
# incidence_si <dbl>, percent_si <dbl>Here are the first five factors associated with fall events from anonymous agency10. I have zeroed out the counts and percent values. To keep the report familiar for the team, I needed to sort the factors by a custom sort order instead of an alphabetical sort. I used case_match() to make a sorting column in the ex_factors table.
Code
ex_factors$sort <- case_match(
  ex_factors$factor,
  "fall" ~ 1,
  "pt_services" ~ 2,
  "referred_pt" ~ 3,
  "no_ft" ~ 4,
  "through_ft" ~ 5,
  "current_fpp" ~ 6,
  "fall_hist" ~ 7,
  "ac_behav" ~ 8,
  "H_E" ~ 9,
  "contrib_diag" ~ 10,
  "mobility" ~ 11,
  "vis_deficit" ~ 12,
  "hear_deficit" ~ 13,
  "familiar" ~ 14,
  "unfamiliar" ~ 15,
  "adap_equip_fall" ~ 16,
  "intrinsic" ~ 17,
  "extrinsic" ~ 18,
  "both_ext_int" ~ 19,
  "med_change" ~ 20,
  "prn_sed" ~ 21,
  "obesity" ~ 22
)
I had originally consulted Stack Overflow but I couldn’t find apparent solutions. Additionally, you can specify ordered factors in R which is the usual method for downstream visualization and analysis1. For my example, “factors” is more like “categories of factors” and I preferred case_match() for this use case. Another solution within the tidyverse is to implement dplyr::row_number(), but I would still have to specify an ordered vector of category names.
A gt table with custom row order
An example table output is below:
Code
ex_factors |>
  ungroup() |>
  arrange(sort) |>
  select(!sort) |>
  select(anon_agency,
         factor,
         region_count,
         incidence) |>
  group_by(anon_agency) |>
  gt(rowname_col = "factor") |>
  cols_label(
    region_count = "Region #",
    incidence = "Agency #",
)| Region # | Agency # | |
|---|---|---|
| agency10 | ||
| Falls | 0 | 0 |
| Referred PT | 0 | 0 |
| No Falls Training | 0 | 0 |
| Current Falls Prevention Plan (FPP) | 0 | 0 |
| Hx. of Falls | 0 | 0 |
| Medical Condition | 0 | 0 |
| Impaired Gait | 0 | 0 |
| Visual Deficits | 0 | 0 |
| Hearing Deficits | 0 | 0 |
| Familiar Environment | 0 | 0 |
| Intrinsic | 0 | 0 |
| Both Intrinsic and Extrinsic | 0 | 0 |
| Obesity | 0 | 0 |
The table is grouped by agency and implements custom column names for comparing event rate to the region at large and serious injury (SI) outcome rates for each factor. I also changed the factor names for friendly viewing with another call to case_match() (not shown). For the factors present during any single fall events at agency10, those factors are sorted by the desired sort order specified above.
Sort order with DataFrame methods
While I was learning about data processing with Python, I came across some key methods relevant to the problem described in my post. In the next code chunk I worked on the row-sorting problem using pandas in Python.
Code
import pandas as pd

exFactors = r.ex_factors

sort = ['fall', 'pt_services', 'referred_pt', 'no_ft',
    'through_ft', 'current_fpp', 'fall_hist', 'ac_behav',
    'H_E', 'contrib_diag', 'mobility', 'vis_deficit',
    'hear_deficit', 'familiar', 'unfamiliar', 'adap_equip_fall',
    'intrinsic', 'extrinsic', 'both_ext_int', 'med_change',
    'prn_sed', 'obesity']

labs = ('Falls', 'PT Services', 'Referred PT', 'No Falls Training',
    'Through Falls Training', 'Current Falls Prevention Plan (FPP)',
    'Hx. of Falls', 'Aggressive/Compulsive', 'Hold/Escape',
    'Medical Condition', 'Impaired Gait', 'Visual Deficits',
    'Hearing Deficits', 'Familiar Environment', 'Unfamiliar Environment',
    'Adaptive Equipment', 'Intrinsic', 'Extrinsic',
    'Both Intrinsic and Extrinsic', 'Medication Change', 'PRN Sedation', 'Obesity')

name = {}

for f, s in zip(sort, labs):
  name[f] = s

exFactorsDf = exFactors[exFactors['anon_agency'] == 'agency10'] \
    [['factor','region_count', 'incidence']] \
    .set_index('factor') \
    .reindex(index=sort) \
    .rename(index=name)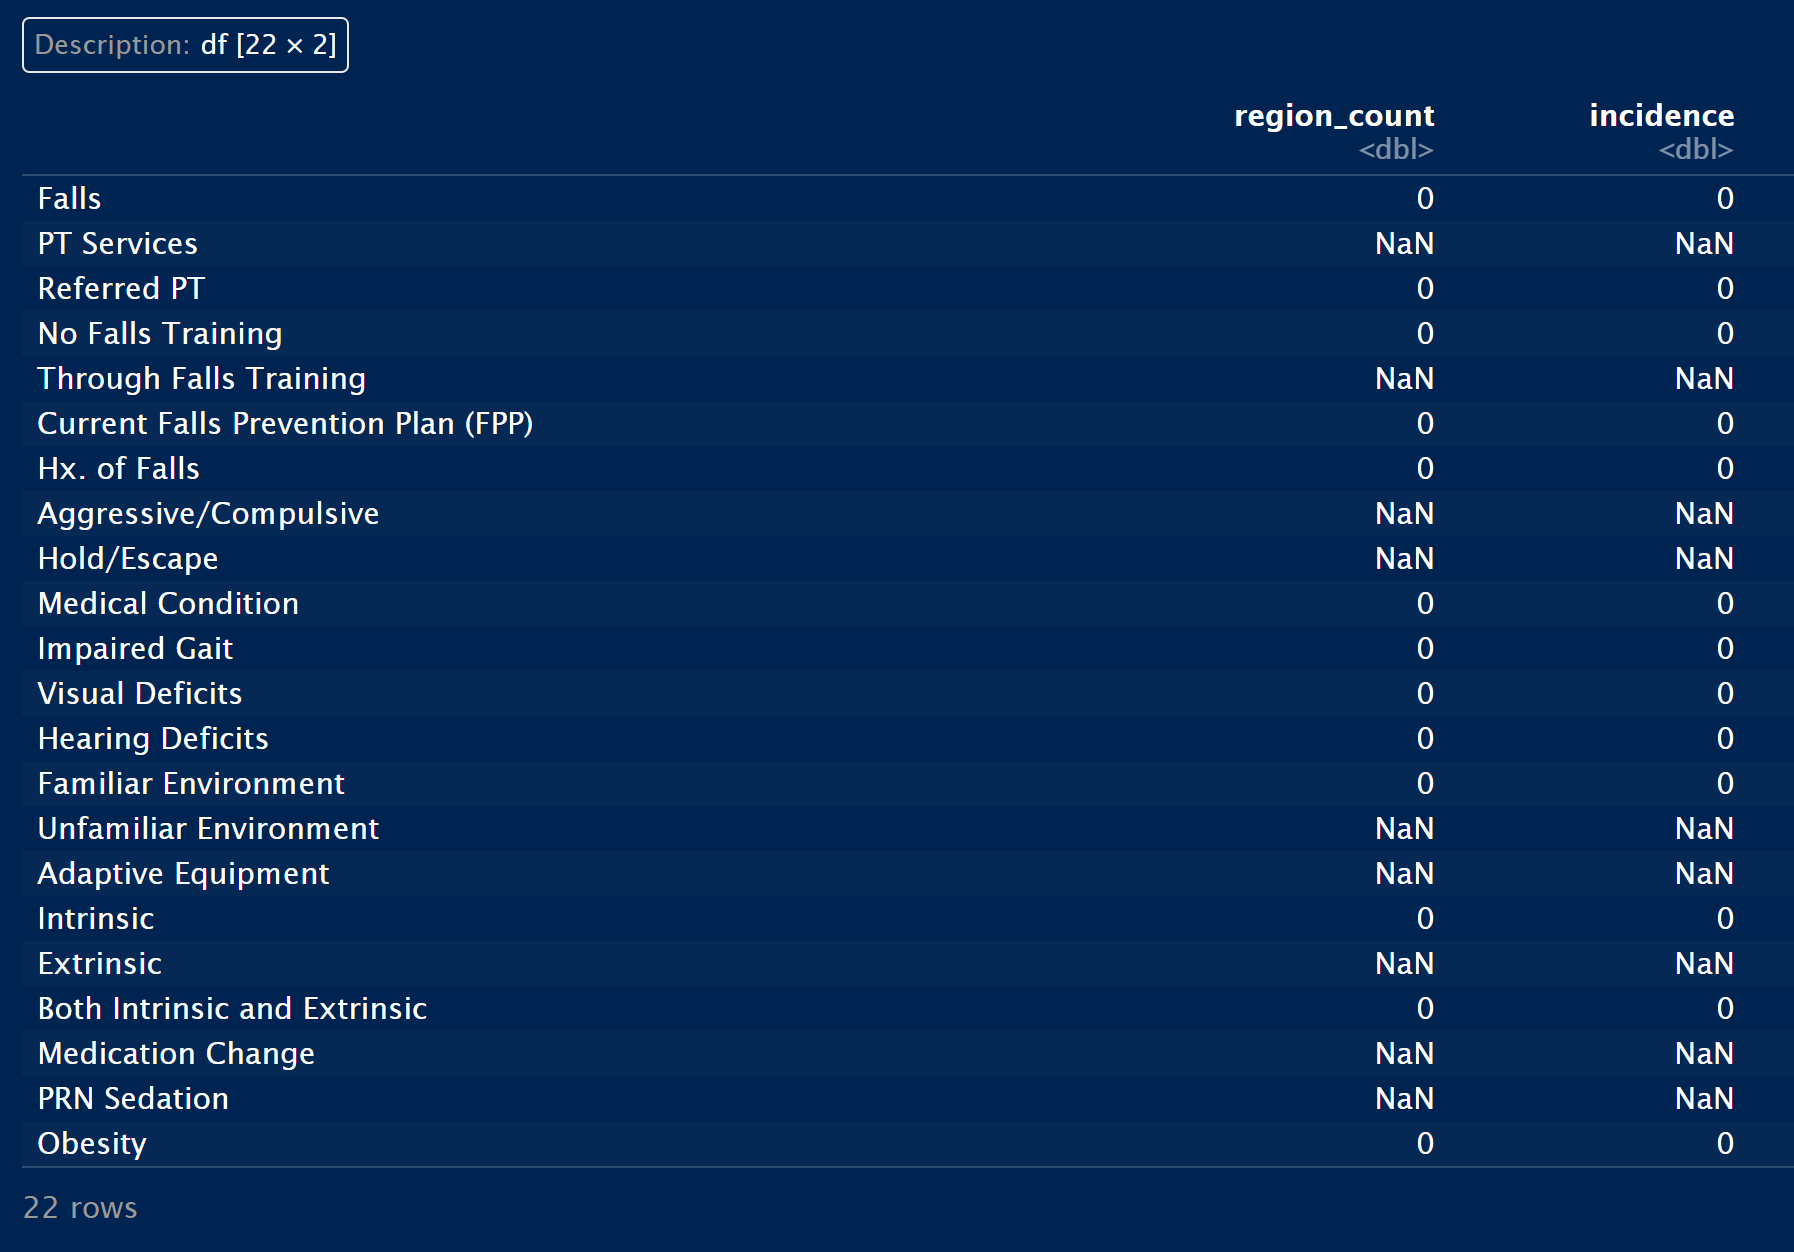
There was an interesting glitch affecting the table display so I had to screenshot the output in R Studio for this example.
Two helpful methods in this solution centered on DataFrame indexing: .set_index() and .reindex(). The output table also keeps track of categories that were not involved in fall events at agency10. The tidyverse method I used has an extra join step to obtain missing categories.
Conclusion
I specified multiple tidying steps in R Quarto to obtain report-ready tables. As a result, the R Quarto approach preserves the team’s current data entry strategy. The row-sorting solution allowed me to deliver exactly what was helpful for the therapeutic services team to identify agencies for training opportunities to mitigate adverse outcomes. The next report can be generated by just importing the source data into the Quarto markdown document!
In this post, I shared a solution to customize row appearance in gt tables. Thank you for coming along and happy coding!
Session Info
─ Session info ───────────────────────────────────────────────────────────────
 setting  value
 version  R version 4.2.3 (2023-03-15 ucrt)
 os       Windows 10 x64 (build 19045)
 system   x86_64, mingw32
 ui       RTerm
 language (EN)
 collate  English_United States.utf8
 ctype    English_United States.utf8
 tz       America/New_York
 date     2024-07-31
 pandoc   3.1.1 @ C:/Program Files/RStudio/resources/app/bin/quarto/bin/tools/ (via rmarkdown)
 quarto   1.4.550 @ C:\\Users\\barne\\AppData\\Local\\Programs\\Quarto\\bin\\quarto.exe

─ Packages ───────────────────────────────────────────────────────────────────
 package     * version date (UTC) lib source
 dplyr       * 1.1.4   2023-11-17 [1] CRAN (R 4.4.0)
 forcats     * 1.0.0   2023-01-29 [1] CRAN (R 4.4.0)
 ggplot2     * 3.4.2   2023-04-03 [1] CRAN (R 4.2.3)
 gt          * 0.10.1  2024-01-17 [1] CRAN (R 4.4.0)
 lubridate   * 1.9.3   2023-09-27 [1] CRAN (R 4.4.0)
 purrr       * 1.0.2   2023-08-10 [1] CRAN (R 4.4.0)
 readr       * 2.1.4   2023-02-10 [1] CRAN (R 4.2.3)
 reticulate  * 1.28    2023-01-27 [1] CRAN (R 4.2.3)
 sessioninfo * 1.2.2   2021-12-06 [1] CRAN (R 4.2.3)
 stringr     * 1.5.0   2022-12-02 [1] CRAN (R 4.2.3)
 tibble      * 3.2.1   2023-03-20 [1] CRAN (R 4.2.3)
 tidyr       * 1.3.0   2023-01-24 [1] CRAN (R 4.2.3)
 tidyverse   * 2.0.0   2023-02-22 [1] CRAN (R 4.2.3)

 [1] C:/Users/barne/AppData/Local/R/win-library/4.2
 [2] C:/Program Files/R/R-4.2.3/library

─ Python configuration ───────────────────────────────────────────────────────
 python:         C:/Users/barne/AppData/Local/Programs/Python/Python310/python.exe
 libpython:      C:/Users/barne/AppData/Local/Programs/Python/Python310/python310.dll
 pythonhome:     C:/Users/barne/AppData/Local/Programs/Python/Python310
 version:        3.10.5 (tags/v3.10.5:f377153, Jun  6 2022, 16:14:13) [MSC v.1929 64 bit (AMD64)]
 Architecture:   64bit
 numpy:          C:/Users/barne/AppData/Local/Programs/Python/Python310/Lib/site-packages/numpy
 numpy_version:  1.24.4

 NOTE: Python version was forced by RETICULATE_PYTHON_FALLBACK

──────────────────────────────────────────────────────────────────────────────
Footnotes
R for Data Science 2e is a great resource to learn foundational R topics like factors (Chapter 17).↩︎