Code
##sample data with the appearance of input data
load(file = "data/ex_data.rdata")

##clean the data
piv_data <- pivot_longer(
  ex_data,
  cols = names(ex_data[,-1]),
  names_to = "name",
  cols_vary = "fastest"
  )

names(piv_data) <- c("time", "name", "value")

##derive threshold
piv_data <- piv_data |>
         group_by(name) |>
         mutate(
           max = max(value),
           threshold = max*0.1
         )

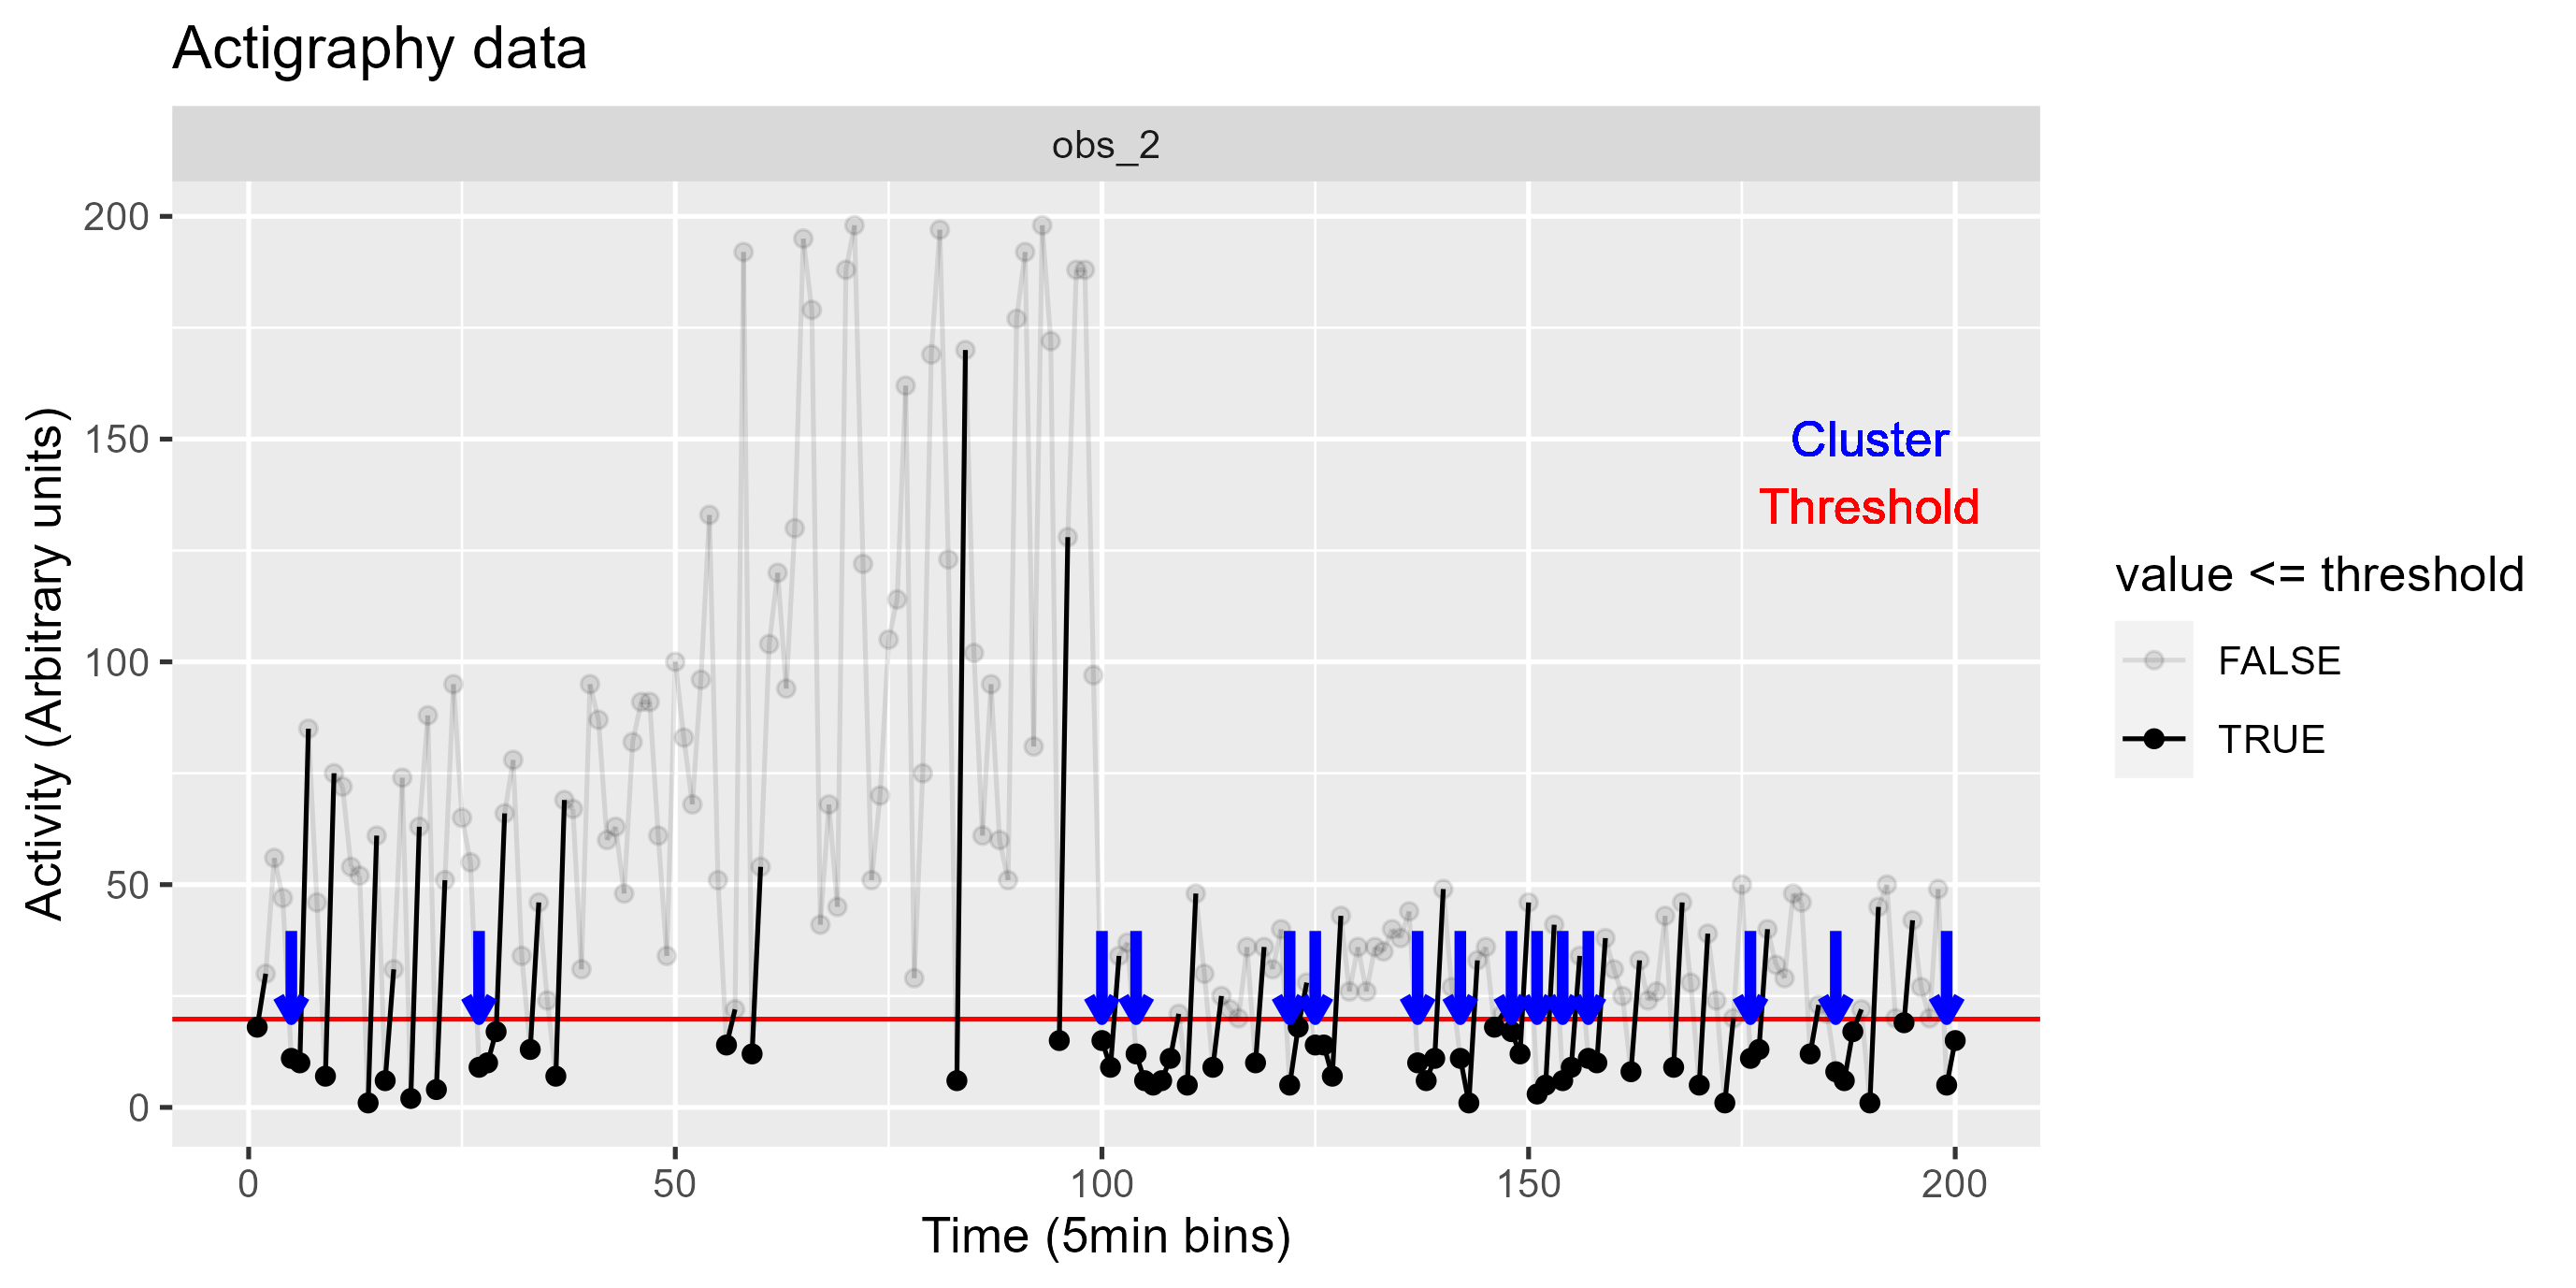
#clustering algorithm
  piv_data_clust <- piv_data |>
    group_by(name) |>
    mutate(id = consecutive_id(value)) |>
    filter(id != 1) |>                               #(3) remove the first set of zeros
    mutate(
      categ = if_else(value > threshold, 0, 1),      #(1) use threshold to categorize vals
      clust_id = consecutive_id(categ)               #set id for consecutive vals
    ) |>
    group_by(name, categ, clust_id) |>
    mutate(
      n = n()                                        #get group size
    ) |>
    group_by(name, clust_id) |>
    filter(categ == 1 & n > 1) |>                    #(2) filter for size > 1
    select(!c(id, categ))

  glimpse(piv_data_clust)
Rows: 65
Columns: 7
Groups: name, clust_id [27]
$ time <int> 4, 5, 5, 6, 6, 7, 8, 20, 21, 22, 27, 28, 29, 44, 45, 60, 61,…
$ name <chr> "obs_3", "obs_2", "obs_3", "obs_2", "obs_3", "obs_3", "obs_3…
$ value <int> 17, 11, 17, 10, 13, 5, 1, 1, 16, 4, 9, 10, 17, 5, 19, 10, 14…
$ max <int> 196, 198, 196, 198, 196, 196, 196, 196, 196, 196, 198, 198, …
$ threshold <dbl> 19.6, 19.8, 19.6, 19.8, 19.6, 19.6, 19.6, 19.6, 19.6, 19.6, …
$ clust_id <int> 3, 2, 3, 2, 3, 3, 3, 11, 11, 11, 14, 14, 14, 8, 8, 16, 16, 2…
$ n <int> 5, 2, 5, 2, 5, 5, 5, 3, 3, 3, 3, 3, 3, 2, 2, 2, 2, 2, 2, 2, …